Macromolecular Crystallography
Crystallography is the method of choice for determining protein structures. It is the corner stone of structure-based drug design (SBDD), an essential tool of modern drug discovery. Below is an overview of the technique.
Crystallization
Obtaining single crystals that diffract to high resolution remains the primary bottleneck of protein crystallography. The most widely used crystallization method is the hanging-drop method of vapor diffusion, in which a drop (1 mL) of protein is mixed with an equal volume of a precipitant on a glass cover slip and is sealed over a well containing the same precipitant added to the protein. Many factors are known to be important in protein crystallization. These factors include, but are not limited to:
- Protein purity (preferably greater than 95% pure) and concentration (typically 10 mg/mL)
- The nature and concentration of precipitant (e.g. polyethylene-glycol or various salts)
- The nature, concentration and pH of the buffer
- The presence or absence of additives (e.g. metal ions, reducing agents, protease inhibitors, metal chelators, detergents) and effectors (e.g. ligands, cofactors, substrates, inhibitors)
- The rate of equilibrium between the protein and the precipitant
- Crystallization temperature
Since there are no general rule to correlate all these factors to the eventual success in obtaining crystals, protein crystallization remains a trial-and-error process and a significant bottleneck in protein crystallography. Many methods and techniques have been employed to enhance ones ability to obtain protein crystals. Molecular biology and biochemical methods have been utilized to generate domains of large proteins that may be less flexible and thus more amenable to crystallization. Biophysical tools such as dynamic light scattering and ultracentifugation have been used to study protein aggregation in solution. Molecular biology has been employed to generate mutants that do not aggregate or that are more soluble. Crystallization trials using incomplete factorial designs allow the screening of a much wider range of conditions with a modest number of experiments, and thus less protein. Miniaturization and automation using advanced crystallization robots also have had a great impact on the success of protein crystallization.
X-ray Diffraction Data Acquisition
Once single crystals are obtained, data are usually measured using an area detector such as a phosphorous image plate or a charge-coupled device (CCD). Through several steps of computational analysis, the position and amplitude or intensity of each diffraction spot can be obtained. Through several steps of computational analysis, the position and amplitude or intensity of the each diffraction spot can be obtained. Because diffraction intensities are proportional to the volume of the crystal and generally decrease at higher resolution, protein crystals have to be reasonably large to give strong enough diffraction signals at high resolution. While a cube of at least 0.2 mm in each dimension is still preferred by most crystallographers, the availability of powerful synchrotron radiation sources has made the analysis of much smaller crystals feasible. Crystals also have to be stable enough in the X-ray beam to allow the measurement of a complete diffraction data set from a single crystal. In this regard, flash-freezing of protein crystals under proper conditions at cryogenic temperatures has virtually eliminated radiation decay problems.
Phasing
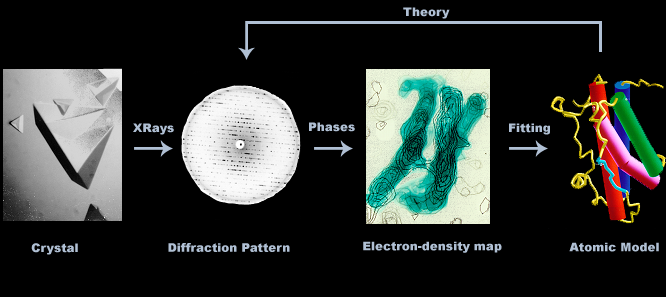
The ultimate goal of an X-ray diffraction experiment is to produce an electron density map that is then used to build an atomic model of the molecule being studied. The determination of the three-dimensional structure of molecules using single crystal X-ray diffraction techniques requires the measurement of amplitudes and the calculation of phases for each diffraction spot. Although amplitudes can be directly measured from diffracting crystals, phases are indirectly determined. The inability to directly measure phases is known as the "phase problem". In practice, there are several ways to get around the phase problem. If the protein of interest is small (~100 amino acids) and high resolution data (1.2 Å or better) are available, phases can be obtained computationally using a technique called "direct method". This is basically the same technique used to determine crystal structures of small organic molecules. If the protein being studied has a fold similar to that of a protein with a known three-dimensional structure, a method known as molecular replacement (MR) is utilized, in which the known structure is used as a model to generate approximate phases that are then refined against the experimental data obtained from crystals of the protein under study. Until recently, multiple isomorphous replacement (MIR) was the most widely used method for ab initio phase determination. This technique requires the introduction of atoms of high atomic number (heavy atoms) such as mercury, platinum, uranium, and so forth, into the protein under study without disrupting its three-dimensional structure or packing in the crystal. This is achieved by soaking crystals in a solution containing the desired heavy atom. The binding of one or more heavy atoms to the protein alters the diffraction of the crystals from that of the underivatized (native) crystals. If the introduction of heavy atoms is truly isomorphous, the differences between the diffraction of the derivative and native will represent only contributions from the heavy atom(s). Thus, the problem of structure determination is reduced to locating the position of one or a few heavy atoms. Once the positions of heavy atoms are accurately determined, they are used to calculate phases for all diffraction intensities. In theory, one needs only two isomorphous derivatives, but in practice more are needed owing to errors that get introduced in data measurement as well as the lack of isomorphism. A more recent technique for ab initio phase determination called MAD (multiple-wavelength anomalous dispersion) phasing has gained popularity in the last 15 years, and is now the predominant method used in de novo structure determination. In that technique, cells that over-express the protein can be grown in a media containing seleno-methionine instead of methionine, producing proteins that have Se-Met at all the Met positions. Because of the unique Se absorption quality of Se, diffraction data can be measured using a Se-Met substituted crystal at three or four different wavelengths around the Se absorption edge. These data can be analyzed using computational methods to generate phase information, allowing an electron density map to be calculated. Such an experiment can only be carried out using modern synchrotron facilities.
Model Building and Refinement
Once an electron density map becomes available, atoms may be fitted into the map using computer graphics to give an initial structural model of the protein. The quality of the electron density map and structural model may be improved through iterative structural refinement, but will ultimately be limited by the resolution of the diffraction data. At low resolution, electron density maps have very little detailed features and tracing the protein chain can be rather difficult without some knowledge of the protein structure. At better than 3.0 Å resolution, amino acid side chains can be recognized with the help of protein sequence information, while at better than 2.5 Å resolution solvent molecules can be observed and added to the structural model with some confidence. As the resolution improves to better than 2.0 Å resolution, fitting of individual atoms may be possible and most of the amino acid side chains can be readily assigned even in the absence of sequence information.
Understanding Structural Coordinates
Once a crystal structure is determined, the information is communicated in the form of an atomic coordinates file. In addition to a list of the atomic positions, the coordinates file contains other information that deserves an explanation. Below is a brief explanation of some of the terms included in an atomic coordinates file.
The unit cell is the basic microscopic building block of the crystal. A crystal can be viewed as a three-dimensional stack of identical unit cells, each defined by three cell edges (a, b, c in Å), and three angles (α, β, γ, in degrees) between each pair of edges. Each unit cell may contain one or more protein molecules related by crystal symmetry. The unique portion of the unit cell, i.e., the portion that is not related to other portions by crystal symmetry is called the asymmetric unit. There are only 230 different combinations of symmetry elements in crystals; each of these is called a space group. However, since biological molecules are enantiomorphic, and thus a protein crystal cannot contain mirror planes the number of space groups of relevance to protein crystallography is reduced to 65. It is possible to have more than one copy of the same protein in an asymmetric unit. However, these will be related by "non-crystallographic" symmetry. Therefore, all atoms of an asymmetric unit, along with the unit cell dimensions and the space group, must be given in the coordinates file for subsequent analysis and for re-generating the structure in any portion of the unit cell or the crystal, which may be important for studying inter-molecular "crystal packing" interactions.
The R-factor is probably the single most important number that provides a sense of the overall quality of the structure. It is a measurement of the agreement between the structural model and the observed diffraction data; the lower the number the better it is. For a refined crystal structure, the R-factor is often approximately ten times its resolution, i.e., 20% for a 2.0 Å resolution structure. Along with the traditional R-factor, structures also report an Rfree value, which is obtained from the part of the diffraction data (5-10%) that were set aside and not used during structural refinement. Rfree is generally 5-10% higher than R; larger discrepancies between the two may indicate that there is a problem in the structure model or diffraction data, or the structure is over-refined against the data. Reducing R to below 20% used to be the goal for structural refinement; but obtaining a sensible Rfree is now considered to be more important. Therefore, before analyzing a crystal structure on computer graphics, one should check the R-factor and Rfree values to get a sense of the overall quality of the structure. It is important to note that these values can be reported as % (20%) or as a fraction (0.20).
The atomic temperature factor, or B-factor, measures the dynamic disorder caused by the temperature-dependent vibration of the atom, as well as the static disorder resulting from subtle structural differences in different unit cells throughout the crystal. For a B-factor of 15 Å2, displacement of an atom from its equilibrium position is approximately 0.44 Å, and it is as much as 0.87 Å for a B-factor of 60 Å2. It is very important to inspect the B-factors during any structural analysis: a B-factor of less than 30 Å2 for a particular atom usually indicates confidence in its atomic position, but a B-factor of higher than 60 Å2 likely indicates that the atom is disordered.
For a particular crystal, the number of diffraction data increases as the resolution increases, which means more experimental data will be available for structural refinement. There are four parameters to be refined for each atom: x, y, z (atomic position), and B (temperature factor). If the crystal has normal solvent content, i.e. about 50%, the number of experimental data and refinement parameters will be about the same at 2.8 Å resolution. This suggests that B-factors for individual atoms should only be refined when data is better than 2.8 Å resolution. Refinement of atomic B-factors at lower resolution will have no physical meaning, although will result in a lower but meaningless R-factor. Identification and refinement of solvent molecules (e.g. waters) become reliable only when the structure is at least 2.5 Å resolution. Even then, before a water molecule is used in mechanistic or computational analysis, it is always wise to check its B-factor and to see if there exists at least one hydrogen bond to hold the water to the protein. At times, spurious water molecules are added (such additions will result in a meaningless lower R-factor). Unless the structure has been determined at a reasonably high resolution, electron density and refinement often do not discriminate between the oxygen and nitrogen atoms of asparagines and glutamines, or the alternative conformations of histidine side chains. In a detailed structural analysis, it may be necessary to check alternative conformations of Asn, Gln or His side chains and decide which one makes more sense chemically.
In summary, it is hoped that the above information will provide the reader with insights to evaluate the quality of the structure, distinguish between its well-defined and flexible regions and make sensible decisions in structural analysis.